# Monitoring
> [!NOTE]
> AI Gateway requires the [AI Governance Add-On](https://coder-9oph77q2q.coderite.app/docs/ai-coder/ai-governance.md).
> As of Coder v2.32, deployments without the add-on will not be able to
> access AI Gateway.
AI Gateway records the last `user` prompt, token usage, model reasoning, and every tool invocation for each intercepted request. Each capture is tied to a single "interception" that maps back to the authenticated Coder identity, making it easy to attribute spend and behaviour.
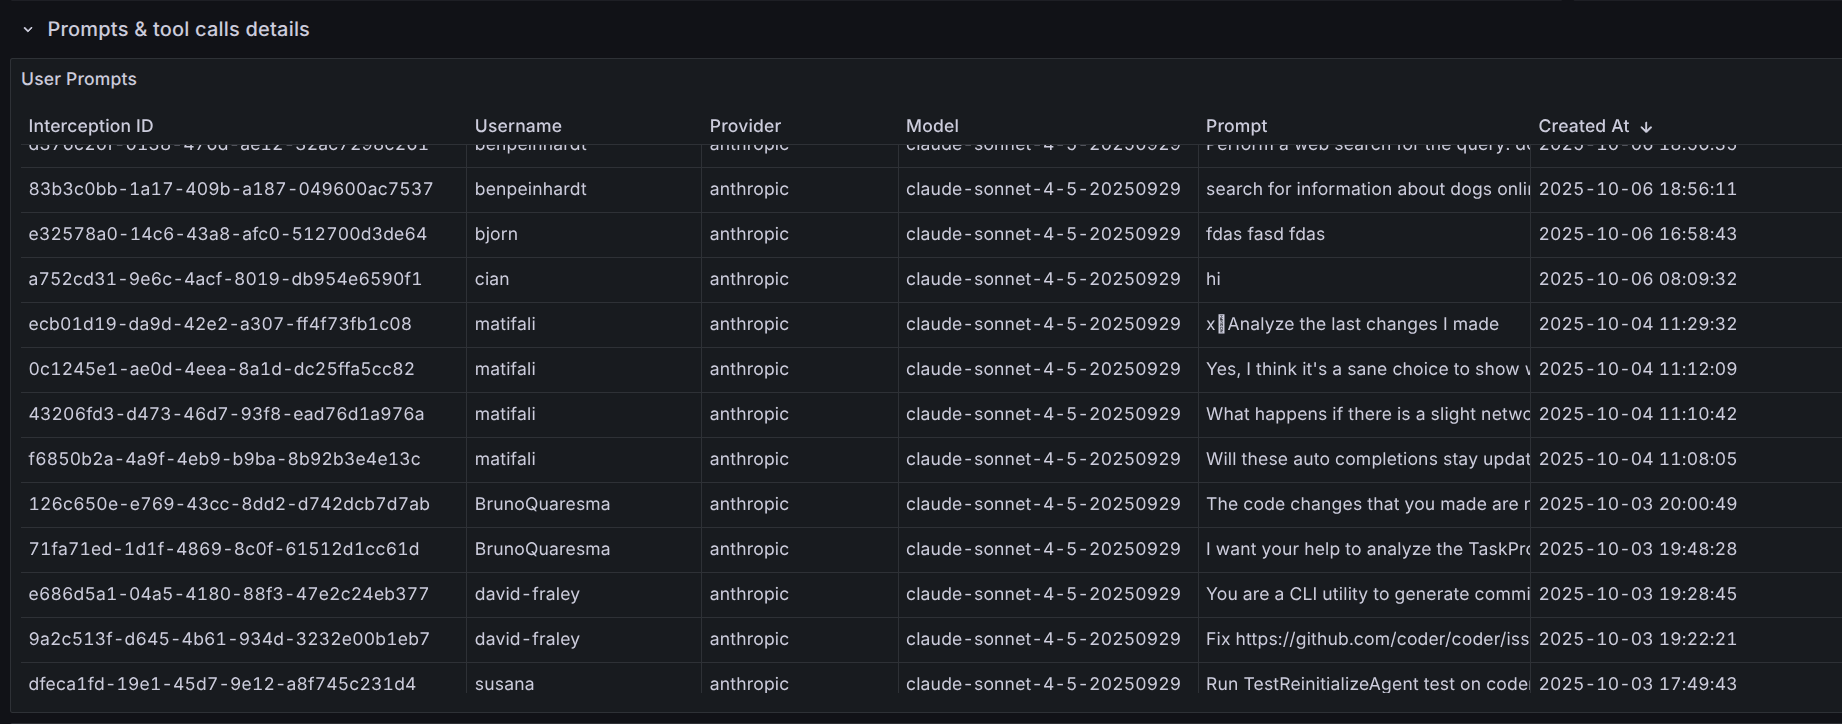
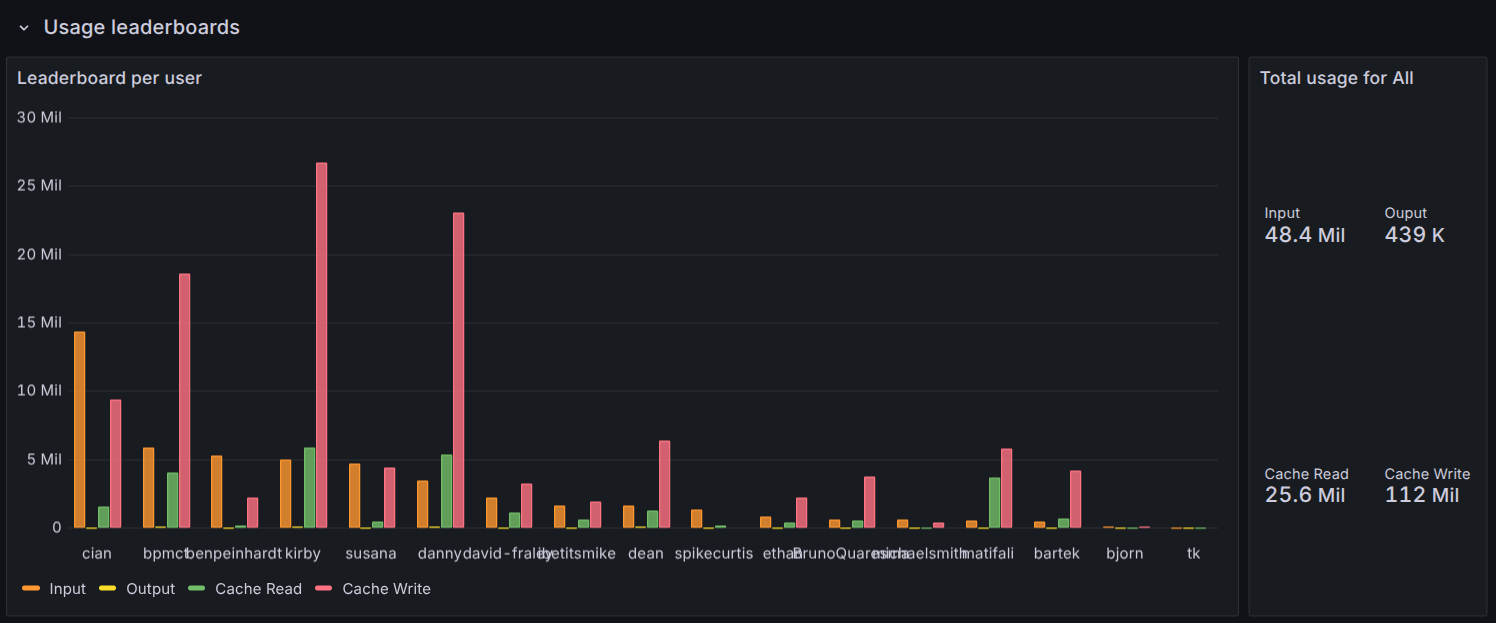
We provide an example Grafana dashboard that you can import as a starting point for your metrics. See [the Grafana dashboard README](https://github.com/coder/coder/blob/main/examples/monitoring/dashboards/grafana/aibridge/README.md).
These logs and metrics can be used to determine usage patterns, track costs, and evaluate tooling adoption.
## Provider metrics
`aibridged` (the in-process daemon) and `aibridgeproxyd` (the external
proxy) each export Prometheus metrics describing the configured
provider pool and its reload loop. See
[Provider Configuration](https://coder-9oph77q2q.coderite.app/docs/ai-coder/ai-gateway/providers.md) for the lifecycle these
metrics describe.
| Metric | Type | Labels | Purpose |
|------------------------------------------------------------------------|---------|--------------------------------------------|--------------------------------------------------------------------------------------------------------------------------------------------|
| `coder_aibridged_provider_info` | gauge | `provider_name`, `provider_type`, `status` | One series per configured provider. Value is always `1`; the `status` label (`enabled`, `disabled`, `error`) carries the alertable signal. |
| `coder_aibridged_providers_last_reload_timestamp_seconds` | gauge | | Unix timestamp of the last reload attempt, success or failure. |
| `coder_aibridged_providers_last_reload_success_timestamp_seconds` | gauge | | Unix timestamp of the last reload that successfully refreshed the pool. |
| `coder_aibridgeproxyd_provider_info` | gauge | `provider_name`, `provider_type`, `status` | Same shape as `aibridged_provider_info` but reported by the external proxy. |
| `coder_aibridgeproxyd_providers_last_reload_timestamp_seconds` | gauge | | Last reload attempt timestamp in `aibridgeproxyd`. |
| `coder_aibridgeproxyd_providers_last_reload_success_timestamp_seconds` | gauge | | Last successful reload timestamp in `aibridgeproxyd`. |
| `coder_aibridgeproxyd_connect_sessions_total` | counter | `type` (`mitm`, `tunneled`) | CONNECT sessions established by the proxy. |
| `coder_aibridgeproxyd_mitm_requests_total` | counter | `provider` | MITM requests handled. |
| `coder_aibridgeproxyd_inflight_mitm_requests` | gauge | `provider` | In-flight MITM requests. |
| `coder_aibridgeproxyd_mitm_responses_total` | counter | `code`, `provider` | MITM responses by HTTP status code. |
### Suggested alerts
Alert on any provider entering a non-`enabled` status:
```promql
sum by (provider_name, status) (coder_aibridged_provider_info{status!="enabled"}) > 0
```
Alert when the reload loop is firing but failing to refresh the pool
for longer than a few minutes:
```promql
(coder_aibridged_providers_last_reload_timestamp_seconds
- coder_aibridged_providers_last_reload_success_timestamp_seconds) > 300
```
Repeat the same query against `coder_aibridgeproxyd_*` if you run the
external proxy.
## Structured Logging
AI Bridge can emit structured logs for every interception event to your
existing log pipeline. This is useful for exporting data to external SIEM or
observability platforms. See [Structured Logging](https://coder-9oph77q2q.coderite.app/docs/ai-coder/ai-gateway/setup.md#structured-logging)
in the setup guide for configuration and a full list of record types.
## Exporting Data
AI Gateway interception data can be exported for external analysis, compliance reporting, or integration with log aggregation systems.
### REST API
You can retrieve AI Gateway sessions via the Coder API, with filtering and pagination support.
```sh
curl -X GET "https://coder.example.com/api/v2/aibridge/sessions" \
-H "Coder-Session-Token: $CODER_SESSION_TOKEN"
```
Available query filters:
- `client` - Filter by client name.
Possible client values
> [!NOTE]
> Client classification is done on best effort basis using the `User-Agent` header;
not all clients send these headers in an easily-identifiable manner.
- `Claude Code`
- `Codex`
- `Zed`
- `GitHub Copilot (VS Code)`
- `GitHub Copilot (CLI)`
- `Kilo Code`
- `Coder Agents`
- `Mux`
- `Cursor`
- `Unknown`
- `initiator` - Filter by user ID or username
- `provider` - Filter by AI provider (e.g., `openai`, `anthropic`)
- `model` - Filter by model name
- `started_after` - Filter interceptions after a timestamp
- `started_before` - Filter interceptions before a timestamp
See the [API documentation](https://coder-9oph77q2q.coderite.app/docs/reference/api/aibridge.md) for full details.
### CLI
Export interceptions as JSON using the CLI:
```sh
coder aibridge interceptions list --initiator me --limit 1000
```
You can filter by time range, provider, model, and user:
```sh
coder aibridge interceptions list \
--started-after "2025-01-01T00:00:00Z" \
--started-before "2025-02-01T00:00:00Z" \
--provider anthropic
```
See `coder aibridge interceptions list --help` for all options.
## Data Retention
AI Gateway data is retained for **60 days by default**. Configure the retention
period to balance storage costs with your organization's compliance and analysis
needs.
For configuration options and details, see [Data Retention](https://coder-9oph77q2q.coderite.app/docs/ai-coder/ai-gateway/setup.md#data-retention)
in the AI Gateway setup guide.
## Tracing
AI Gateway supports tracing via [OpenTelemetry](https://opentelemetry.io/),
providing visibility into request processing, upstream API calls, and MCP server
interactions.
### Enabling Tracing
AI Gateway tracing is enabled when tracing is enabled for the Coder server.
To enable tracing set `CODER_TRACE_ENABLE` environment variable or
[--trace](https://coder.com/docs/reference/cli/server#--trace) CLI flag:
```sh
export CODER_TRACE_ENABLE=true
```
```sh
coder server --trace
```
### What is Traced
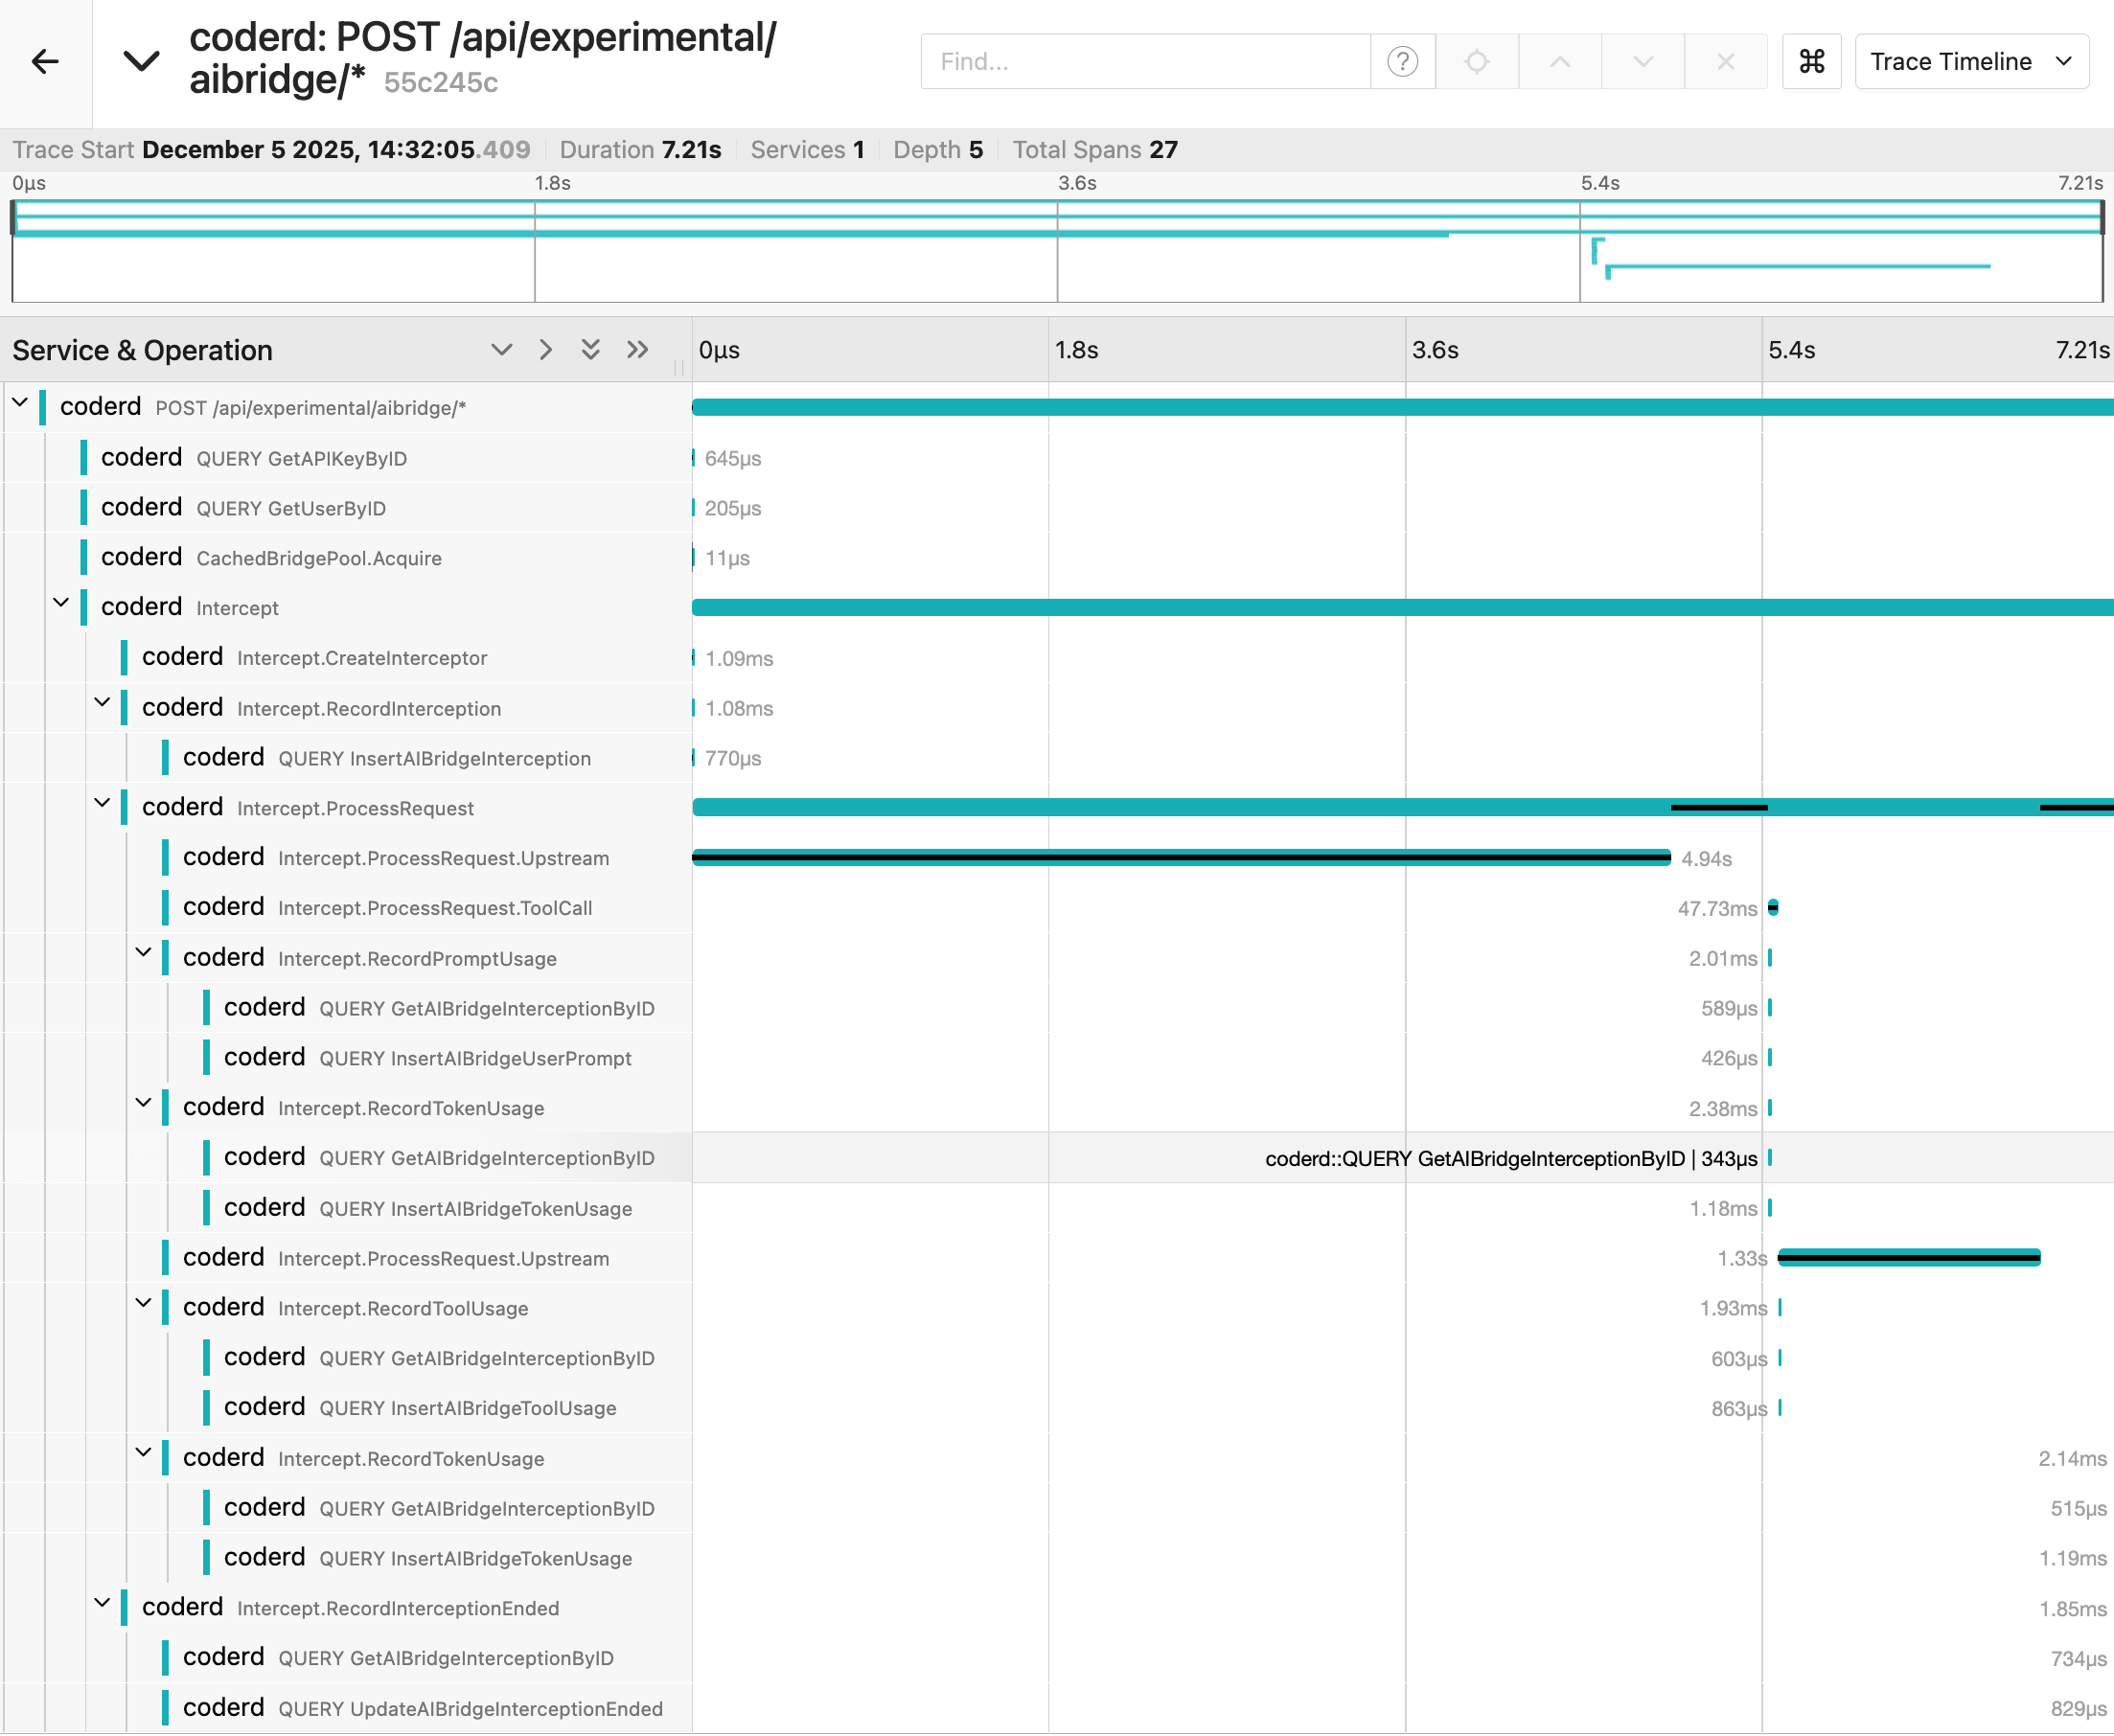
AI Gateway creates spans for the following operations:
| Span Name | Description |
|---------------------------------------------|------------------------------------------------------|
| `CachedBridgePool.Acquire` | Acquiring a request bridge instance from the pool |
| `Intercept` | Top-level span for processing an intercepted request |
| `Intercept.CreateInterceptor` | Creating the request interceptor |
| `Intercept.ProcessRequest` | Processing the request through the bridge |
| `Intercept.ProcessRequest.Upstream` | Forwarding the request to the upstream AI provider |
| `Intercept.ProcessRequest.ToolCall` | Executing a tool call requested by the AI model |
| `Intercept.RecordInterception` | Recording creating interception record |
| `Intercept.RecordPromptUsage` | Recording prompt/message data |
| `Intercept.RecordTokenUsage` | Recording token consumption |
| `Intercept.RecordToolUsage` | Recording tool/function calls |
| `Intercept.RecordInterceptionEnded` | Recording the interception as completed |
| `ServerProxyManager.Init` | Initializing MCP server proxy connections |
| `StreamableHTTPServerProxy.Init` | Setting up HTTP-based MCP server proxies |
| `StreamableHTTPServerProxy.Init.fetchTools` | Fetching available tools from MCP servers |
Example trace of an interception using Jaeger backend:
### Capturing Logs in Traces
> [!NOTE]
> Enabling log capture may generate a large volume of trace events.
To include log messages as trace events, enable trace log capture
by setting `CODER_TRACE_LOGS` environment variable or using
[--trace-logs](https://coder.com/docs/reference/cli/server#--trace-logs) flag:
```sh
export CODER_TRACE_ENABLE=true
export CODER_TRACE_LOGS=true
```
```sh
coder server --trace --trace-logs
```